Summary: Between 11 and 17 February 2024, we’ve seen more Bee Network bus services running on-time than non-Bee Network bus services over the same period, as well as for the same period last year.
This week, 71.5% of Bee Network buses were on time, compared to 71.0% last week.
About the data:
The Bee Network Punctuality table has three columns showing the percentage of bus services running ‘on time’ each day in a 7-day period.
It shows:
- Pre-Bee Network punctuality: Results for the same period in 2023, before those bus services joined the Bee Network.
- Bee Network punctuality: Results for current Bee Network services.
- Non-Bee Network punctuality: Results for buses in Greater Manchester that are not yet part of the Bee Network.
This allows you to compare past and present performance. The Senior Traffic Commissioner (responsible for licensing and regulating bus services) classes services running between one minute early and five minutes late as ‘on time’. This allows for road traffic conditions which can affect bus running times.
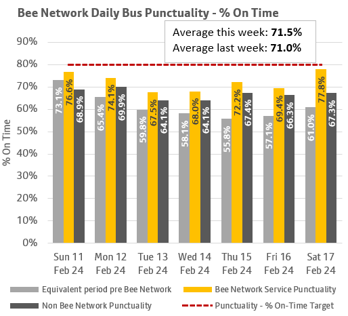
Bee Network daily bus punctuality - % on time
The chart shows daily punctuality data for Bee Network services and non-Bee Network services. It also shows punctuality data for the same services that are now part of the Bee Network, before they came under local control.
This daily punctuality shows that, between 11 and 17 February 2024, Bee Network services were on time more often than both non-Bee Network services and compared to the same period last year on seven of the seven days.
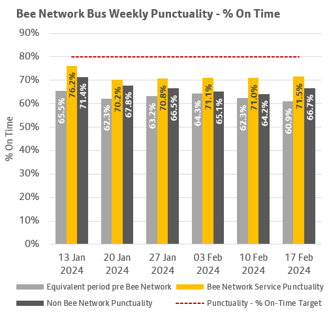
Bee Network weekly bus punctuality - % on time
The chart shows weekly punctuality data for Bee Network services and non-Bee Network services over a six week period ending 17 February 2024. It also shows punctuality data for the same services that are now part of the Bee Network, before they came under local control.
This weekly punctuality data shows that, over a six week period ending 17 February 2024, Bee Network services were on time more often than both non-Bee Network services and compared to the same weekly period last year.
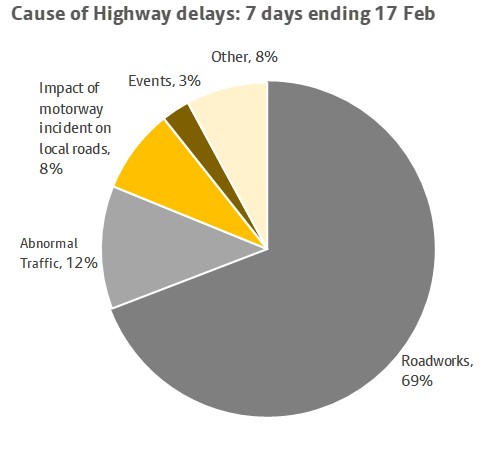
Cause of highway delays
The chart shows the estimated causes of delay on a sample of roads on Greater Manchester’s Key Route Network.
The main causes of delay on highways over the seven days ending 17 February 2024 were roadworks (69%), abnormal traffic (12%) and impact of motorway traffic on local roads (8%).