About the data
The Bee Network Punctuality charts have two columns showing the average percentage of bus services running ‘on time’ each day in a 4-week period.
It shows:
• Pre-Bee Network punctuality: Results for the same period in 2023, before those bus services joined the Bee Network.
• Bee Network punctuality: Results for current Bee Network services.
This allows you to compare past and present performance. The Senior Traffic Commissioner (responsible for licensing and regulating bus services) classes services running between one minute early and five minutes late as ‘on time’. This allows for road traffic conditions which can affect bus running times.
Which districts are included in each 'tranche’
• Tranche 1 = Bolton, Wigan, and parts of Salford, Bury and Manchester - joined the Bee Network on 24 September 2023.
• Tranche 2 = Oldham, Rochdale, and parts of Bury, Salford and north Manchester - joined the Bee Network on 24 March 2024.
• Tranche 3 = Stockport, Tameside, Trafford and the remaining parts of Manchester and Salford – joined the Bee Network on 5 January 2025.
Bee Network daily bus punctuality - % on time
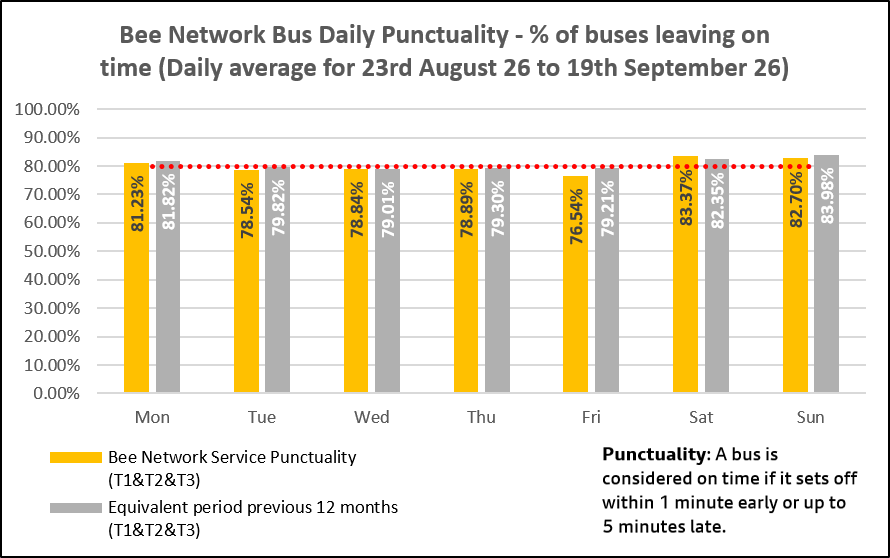
The chart shows average daily punctuality data for T1, T2 and T3 Bee Network services between 23rd August and 19th September 2026. It also shows punctuality data for the same services that are now part of the Bee Network, 12 months previously.
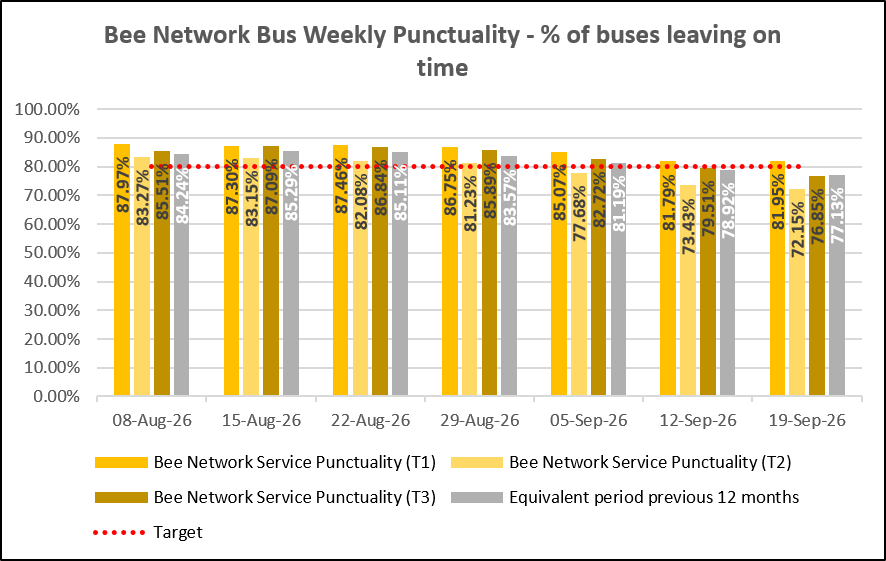
The chart shows weekly punctuality data for T1, T2 and T3 Bee Network services between 8th August and 19th September 2026. It also shows punctuality data for the same services that are now part of the Bee Network, 12 months previously.
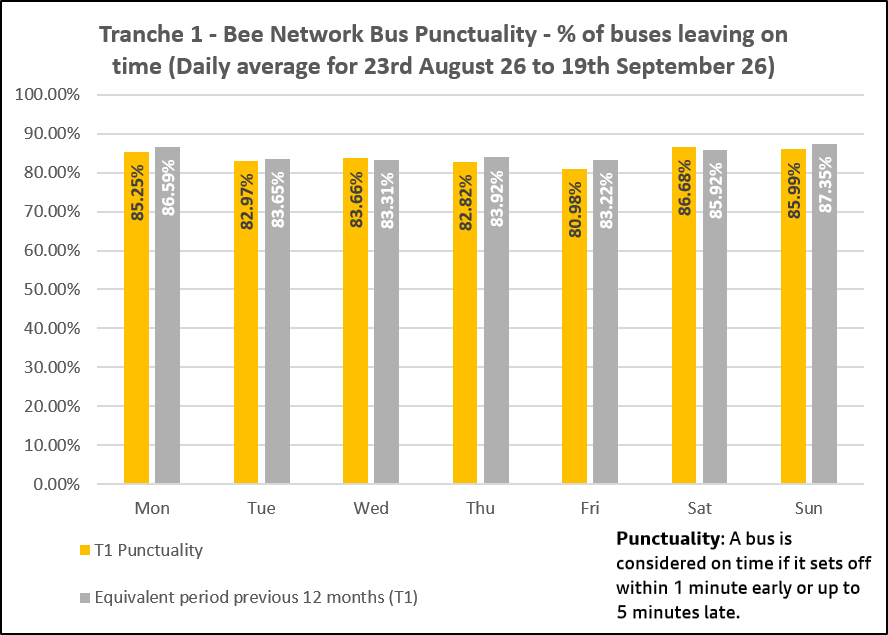
The chart shows average daily punctuality data (between 23rd August and 19th September 2026) for T1 Bee Network services which joined the Bee Network on the 24th September 2023. It also shows punctuality data for the same services, 12 months previously.
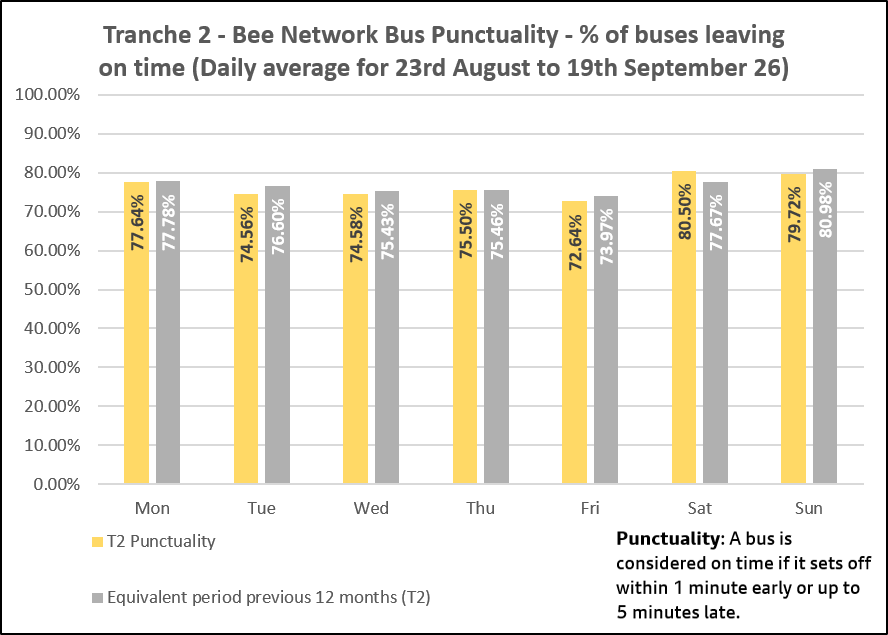
The chart shows average daily punctuality data (between 23rd August and 19th September 2026) for T2 Bee Network services which joined the Bee Network on the 24th March 2024. It also shows punctuality data for the same services, 12 months previously.
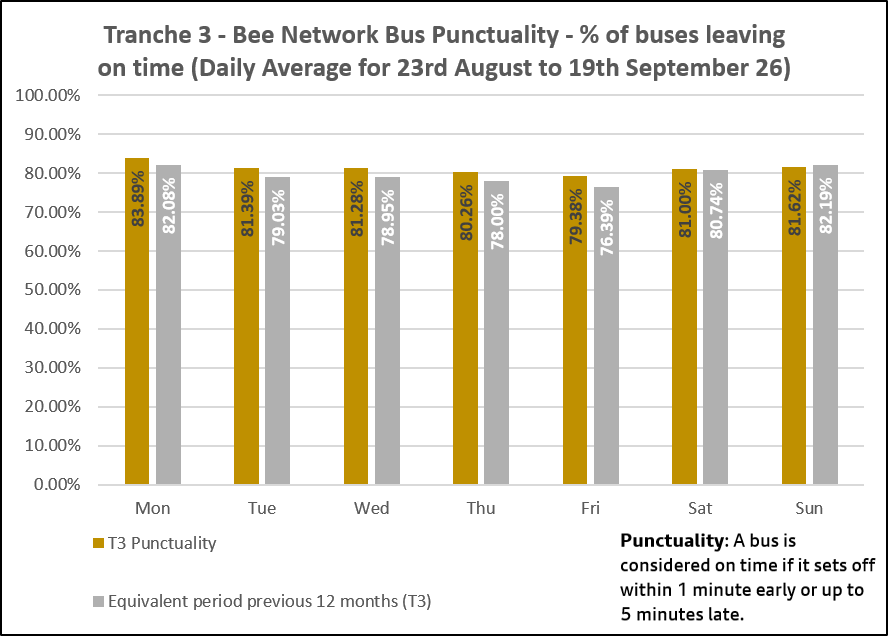
The chart shows average daily punctuality data (between 23rd August and 19th September 2026) for T3 Bee Network services which joined the Bee Network on the 5th January 2025. It also shows punctuality data for the same services, 12 months previously.
Bee Network daily operated kilometres
The below charts show the actual volume of services delivered compared to what was scheduled (operated kilometres*). Scheduled kilometres may not be met because journeys are fully or partially cancelled due to:
• Traffic congestion.
• Available staff.
• Engineering or fleet issues.
*Operated kilometres are provided by the bus operators
Daily operated kilometres
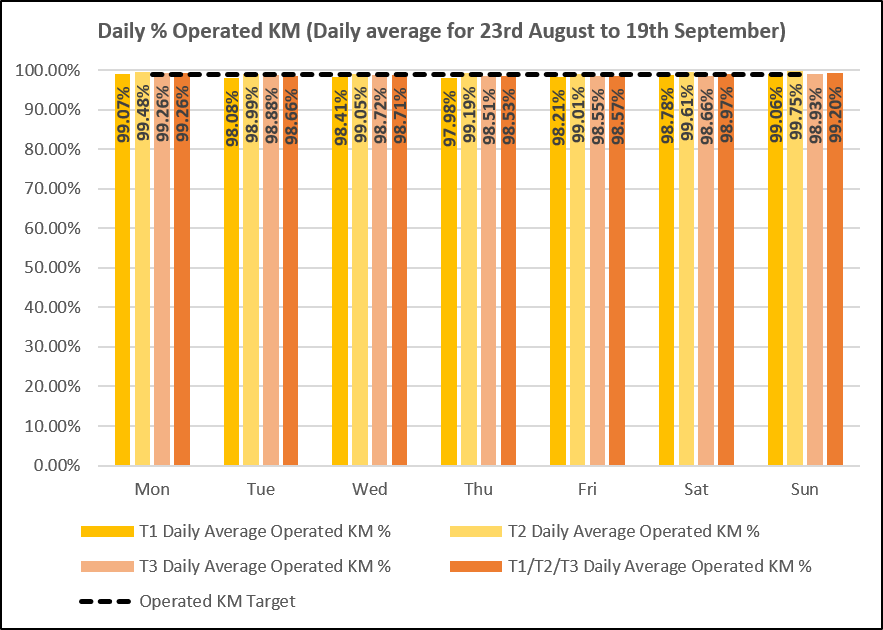
The chart shows average daily % of operated KM for all Bee Network Services between 23rd August and 19th September 2026.
Weekly operated kilometres
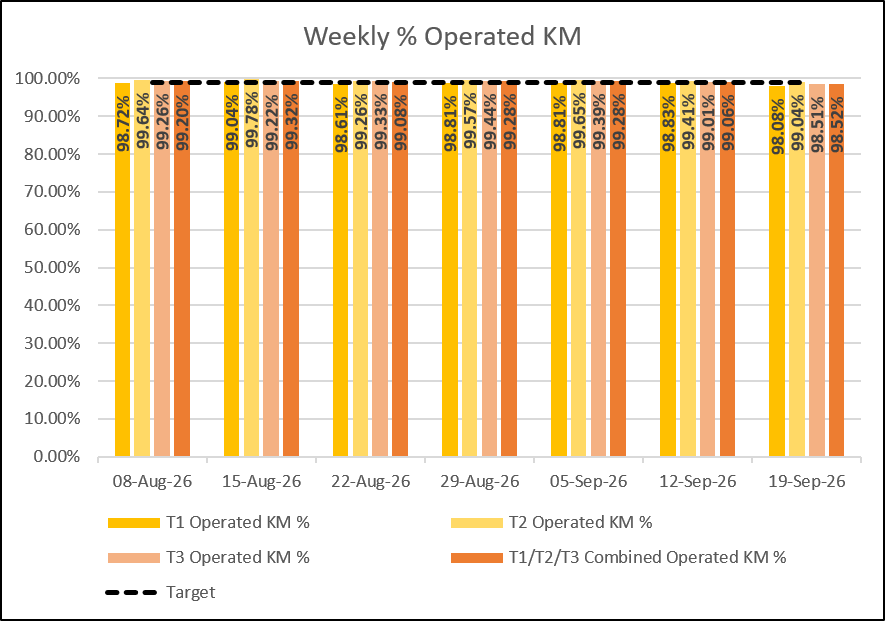
The chart shows weekly % of operated KM for all Bee Network Services between the week ending 8th August 2026 to the week ending 19th September 2026.
Cause of highway delays
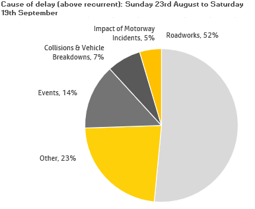
The main causes of delay (above recurrent) on highways during the period 23rd August to 19th September were: roadworks (52%), other (23%), events (14%), collisions & vehicle breakdowns (7%) and impact of motorway incidents (5%).