Summary: Between 7 and 13 April 2024, we’ve seen more Bee Network bus services running on-time than non-Bee Network bus services over the same period, as well as for the same period last year.
Latest punctuality data shows more buses are on time on the Bee Network. This week, 84.4% of Bee Network buses were on time, compared to 82.2% last week.
About the data:
The Bee Network Punctuality table has three columns showing the percentage of bus services running ‘on time’ each day in a 7-day period.
Please note - this data does not include services that joined the Bee Network on 24 March 2024
It shows:
- Pre-Bee Network punctuality: Results for the same period in 2023, before those bus services joined the Bee Network.
- Bee Network punctuality: Results for current Bee Network services.
- Non-Bee Network punctuality: Results for buses in Greater Manchester that are not yet part of the Bee Network.
This allows you to compare past and present performance. The Senior Traffic Commissioner (responsible for licensing and regulating bus services) classes services running between one minute early and five minutes late as ‘on time’. This allows for road traffic conditions which can affect bus running times.
Bee Network daily bus punctuality - % on time
The chart shows daily punctuality data for Bee Network services and non-Bee Network services. It also shows punctuality data for the same services that are now part of the Bee Network, before they came under local control.
This daily punctuality shows that, between 7 and 13 April 2024, Bee Network services were on time more often than both non-Bee Network services and compared to the same period last year on seven of the seven days.

Bee Network weekly bus punctuality - % on time
The chart shows weekly punctuality data for Bee Network services and non-Bee Network services over a six week period ending 13 April 2024. It also shows punctuality data for the same services that are now part of the Bee Network, before they came under local control.
This weekly punctuality data shows that over a six week period ending 13 April 2024, Bee Network services were on time more often than both non-Bee Network services and compared to the same weekly period last year.

Cause of highway delays
The chart shows the estimated causes of unexpected delay on a sample of roads on Greater Manchester’s Key Route Network.
The main causes of delay on highways over the seven days ending 13 April 2024 were roadworks (64%), other (17%) and events (9%).

-
 Learn more about distractions when driving
Touch. Screen.
Don't touch your phone while driving. It's a dangerous, criminal offence.
-
 Learn more about the Bee Network
Say yellow to the Bee Network
Buses in Oldham, Rochdale and parts of Bury, Salford and north Manchester joined the Bee Network on 24 March.
-
 Learn more about new Starling Bank Bikes
New sponsor: Starling Bank Bikes
We’re delighted to welcome Starling Bank on board as the new sponsors of our bike hire scheme.
-
 Find full details of the bus routes, ticket fares and timetables
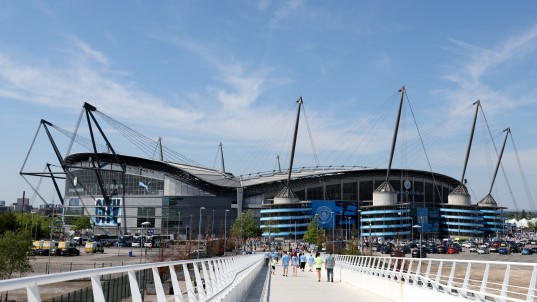
Manchester City Matchday Buses
We've teamed up with Manchester City to launch a large-scale bus trial helping fans from across Greater Manchester and nearby areas to travel to and from the Etihad Stadium on a matchday.
-
 Rate your journey
Rate your journey
We want to hear your views to help us deliver a better Bee Network for Greater Manchester.
-
 Find out about planned works on the tram
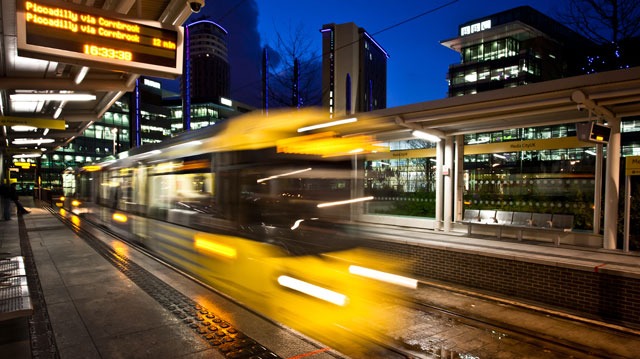
Planned engineering works on Metrolink
Visit our dedicated webpage to find out how the works could affect your journeys.


-
Learn more about distractions when driving
Touch. Screen.
Don't touch your phone while driving. It's a dangerous, criminal offence.
-
Learn more about new Starling Bank Bikes
New sponsor: Starling Bank Bikes
We’re delighted to welcome Starling Bank on board as the new sponsors of our bike hire scheme.
-
Rate your journey
Rate your journey
We want to hear your views to help us deliver a better Bee Network for Greater Manchester.
-
Learn more about the Bee Network
Say yellow to the Bee Network
Buses in Oldham, Rochdale and parts of Bury, Salford and north Manchester joined the Bee Network on 24 March.
-
Find full details of the bus routes, ticket fares and timetables
Manchester City Matchday Buses
We've teamed up with Manchester City to launch a large-scale bus trial helping fans from across Greater Manchester and nearby areas to travel to and from the Etihad Stadium on a matchday.
-
Find out about planned works on the tram
Planned engineering works on Metrolink
Visit our dedicated webpage to find out how the works could affect your journeys.